Yearly Archives: 2016


Ημερίδα Πληροφορικής 2016

Impress/ PowerPoint format Download: [download id=”1337″]

PDF format Download: [download id=”1341″]

7η Ημερίδα Πληροφορικής για μαθητές/τριες Λυκείων και Τεχνικών Σχολών

Ο βασικός στόχος της Ημερίδας Πληροφορικής είναι να ενημερώσει, να διαφωτίσει, αλλά κυρίως να ενθαρρύνει τους νέους μας να ανακαλύψουν τις ευκαιρίες εκπαίδευσης στην Επιστήμη της Πληροφορικής καθώς και να πληροφορηθούν για τις επαγγελματικές προοπτικές που προσφέρει η επιστήμη αυτή. Η ημερίδα στοχεύει κυρίως στους μαθητές της Α’ τάξης Λυκείων και Τεχνικών Σχολών, οι οποίοι βρίσκονται στο κρίσιμο στάδιο της
επιλογής των επόμενων μεταλυκειακών βημάτων τους. Η ημερίδα ευελπιστεί ότι θα βοηθήσει τους συμμετέχοντες να αποκτήσουν μια καλύτερη άποψη για την Επιστήμη της Πληροφορικής. Την προσπάθειά μας αυτή ενισχύει το Υπουργείο Παιδείας και Πολιτισμού καθώς και ο Κυπριακός Σύνδεσμος Πληροφορικής (Cyprus Computer Society – CCS).

hmerida060216

Impress/ PowerPoint format Download: [download id=”1337″]

PDF format Download: [download id=”1341″]


[GitLab.com] Clone all repositories in your account 1

GitLab.com offers a public API that allows us to get information related to our accounts. One of the API calls available is the account projects call (http://gitlab.com/api/v3/projects).

This call will return a JSON object describing the projects available to your account.

To clone all of the projects available to you, you can use the following:

TOKEN="PASTE_YOUR_PRIVATE_TOKEN_HERE"; PREFIX="ssh_url_to_repo"; curl --header "PRIVATE-TOKEN: $TOKEN" http://gitlab.com/api/v3/projects | grep -o "\"$PREFIX\":[^ ,]\+" | awk -F ':' '{printf "ssh://"; for (i=2; i<NF; i++) printf $i "/"; print $NF}' | xargs -L1 git clone

The above code will bring the JSON object, filter out everything except for the “ssh_url_to_repo” member of each project and then it will use it to clone the project by fixing up the URL to be used by git.

To get the above code working: the GitLab API requires that you use a token that is related to your account instead of using your credentials to make the call to the API.

To get your private token, visit this page http://gitlab.com/profile/account , the private token is the random sequence of characters in the white box:

[GitLab.com] Private TokenYou need to copy that value in the place of the variable TOKEN in the above script.

In case you have a lot of projects (more than 10), the default call will only produce the results for the first 10 repositories only.

To list all available repositories you have two options:

  1.  Set the per_page query parameter to a value big enough to fetch all your projects information if they are less than 100. e.g http://gitlab.com/api/v3/projects?per_page=100
  2. Follow the link headers from the initial response to make all the next calls.

[GitLab.com] Get a list with the names of all repositories in your account

GitLab.com offers a public API that allows us to get information related to our accounts. One of the API calls available is the account projects call (http://gitlab.com/api/v3/projects).

This call will return a JSON object describing the projects available to your account.

To get a list of the names of the projects available to you, you can use the following:

TOKEN="PASTE_YOUR_PRIVATE_TOKEN_HERE"; PREFIX="ssh_url_to_repo"; curl --header "PRIVATE-TOKEN: $TOKEN" http://gitlab.com/api/v3/projects | grep -o "\"$PREFIX\":[^ ,]\+" | xargs -L1 basename | awk -F '.' '{print $1}'

The above code will bring the JSON object, filter out everything except for the “ssh_url_to_repo” member of each project and then it will print it out on screen.


To get the above code working: the GitLab API requires that you use a token that is related to your account instead of using your credentials to make the call to the API.

To get your private token, visit this page http://gitlab.com/profile/account , the private token is the random sequence of characters in the white box:

[GitLab.com] Private TokenYou need to copy that value in the place of the variable TOKEN in the above script.


In case you have a lot of projects (more than 10), the default call will only produce the results for the first 10 repositories only.

To list all available repositories you have two options:

  1.  Set the per_page query parameter to a value big enough to fetch all your projects information if they are less than 100. e.g http://gitlab.com/api/v3/projects?per_page=100
  2. Follow the link headers from the initial response to make all the next calls.

[GnuPlot] Create a plot with Date Time on X axis

Download here : [download id=”1309″]

The following script, will read the ‘data.csv’ file and create a plot with the data.
The input file (data.csv) should have two columns: the first one is a date/time string and the second is a number.
e.g

2016-01-19 13:12:38,2
2016-01-19 13:12:38,1
2016-01-19 13:12:38,0
2016-01-19 13:12:40,0
2016-01-19 13:12:41,0
2016-01-19 13:12:47,0

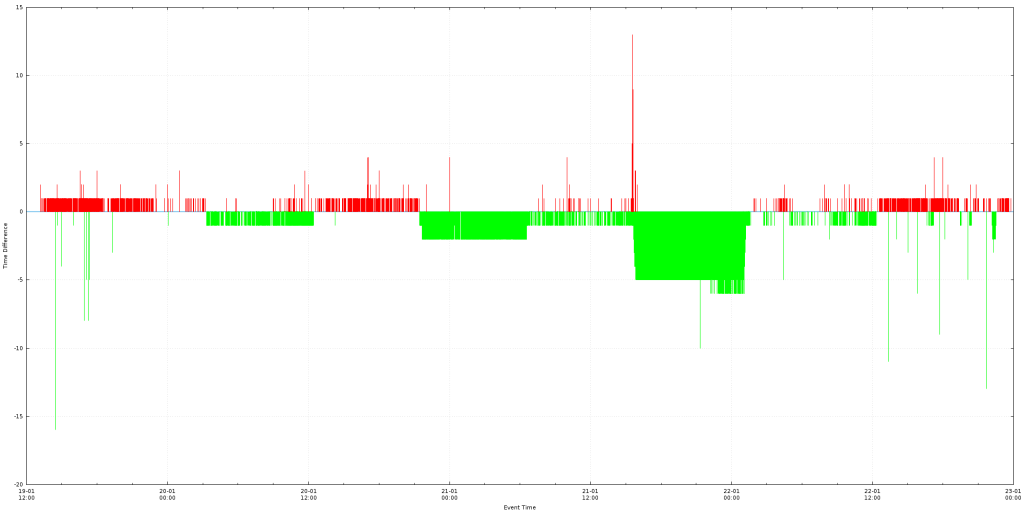
The chart will have on the X axis the date/time and on the Y axis the value of the second column.
All values under the 0 axis will be green and all values above it will be red.

Example output:

data.csv

Execution example: gnuplot -e "filename='data.csv'; width=2000; height=1000;" timeDifference.plot

#Setting output to be a PNG file of size 'width'x'height'
#'width' and 'height' are set from the command line. e.g gnuplot -e "filename='server_1.csv'; width=10000; height=500;" timeDifference.plot
#Setting the font of all text to be 'Verdana' size 8
set terminal pngcairo size width,height enhanced font 'Verdana,8'
#Setting the output filename to be the same as the input filename with the .png extension appended to it.
set output filename.'.png'

#We set the file separator to be the comma, this way we inform the engine that we will be processing a CSV file
set datafile separator ","

#Informing the engine that the X axis of our plot will be date/time data type
set xdata time
#We define how the date/time input must be parsed. In this example we expect the input to be like '2016-01-19 14:25:00'
set timefmt '%Y-%m-%d %H:%M:%S'

#We set the output format that will be shown on the X axis. Here we expect to show '19-01 New Line 14:25"
set format x "%d-%m\n%H:%M"
#Set the X axis label
set xlabel "Event Time"
#Set the Y axis label
set ylabel "Time Difference" 

#Enabling the Grid, this way major tick lines will be visible on the chart
set grid

#As we expect to have negative values as well, we make the zero Y axis line is thicker and has a different style from the rest so that it will be easier to spot
set xzeroaxis linetype 3 linewidth 1.5

#Creating a style for the lines that will be used in the plot. Type = 1, Color = green, Width = 1
set style line 1 linetype 1 linecolor rgb "green" linewidth 1.000
#Creating a style for the lines that will be used in the plot. Type = 1, Color = red, Width = 1
set style line 2 linetype 1 linecolor rgb "red" linewidth 1.000

#Actual plot command
#It directs the engine to plot the file that is in the filename variable, use the first and second column and use vertical columns with the styles we described above
#First line, We will plot only values that are greater or equal to 0, the rest we give 1/0 which is an invalid number and will not be plotted
#Second line, We will plot only values that are strictly less than 0, the rest we give 1/0 which is an invalid number and will not be plotted
plot filename using 1:($2 <= 0?$2:1/0) with impulses ls 1 notitle,\
filename using 1:($2 <= 0?1/0:$2) with impulses ls 2 notitle