Daily Archives: 14 May 2016


bash: Simple way to get n-th column

Using cut you can select any column and define a custom delimiter to support multiple input formats you can select a column (or more) with barely minimum code.

cut -d',' -f2 myFile.csv

The above command will read the file myFile.csv (which is a CSV file) break it down to columns using the ‘,‘ character and then get the second column.

The option -f specifies which field (column) you want to extract, and the option -d specifies what is the field delimiter (column) that is used in the input file.

The -f parameter allows you to select multiple columns at the same time. You can achieve that by defining multiple columns separated using the ‘,‘ and by defining ranges using the - character.

Examples

  • -f1 selects the first column
  • -f1,3,4 selects columns 1, 3 and 4
  • -f1-4 selects all columns in the range 1-4
  • -f1,3,5-7,9 selects columns 1,3,8 and all the columns in the range 5-7

How to randomize order of rows in Excel

In the following video we demonstrate how to randomize the rows of an Excel sheet.

Methodology:

  • We created a new column next to the data we want to randomize their order, then we typed in the first cell the following formula =rand().
    =rand() will generate a random value between 0 and 1.
  • After that we applied the same formula to the entire column.
  • To apply the formula to the whole column we used a very simple method: we double-clicked on the bottom right hand corner of the cell .

Apply formula to whole column by double clicking on the bottom right corner of the cell

  • Later, we sorted our date using the column of random values.
  • Finally, we deleted the new column.


Alternative way to copy the formula to the entire column:

  • Including the cell with the formula, select the cells in the new column that you want the new formula applied to (all the rows you want to be randomized) and the press Ctrl+D.

How to “group by” and sum in Excel

In the following example we used the Subtotal feature to create a spreadsheet that shows the partial sum based on another column.

Methodology:

  1. Click the Data tab in Excel’s ribbon toolbar
  2. Click the Sort button to sort our data by the user column
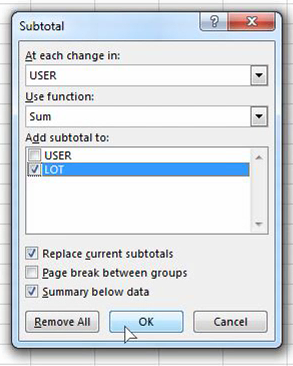
  3. Click the Subtotal button and fill in the dialog as appropriate, then click OK

In our example, we had only two columns (User and Lot), we wanted to produce the total sum of lots per user and so filled the dialog as follows:

Subtotal

What the above options do is the following:

  • Use the User column to group on by checking when its value changes
  • Use the Sum function on the columns that will be selected later on
  • Apply the function on the Lot column