Monthly Archives: January 2016


[GnuPlot] Create a plot with Date Time on X axis

Download here : [download id=”1309″]

The following script, will read the ‘data.csv’ file and create a plot with the data.
The input file (data.csv) should have two columns: the first one is a date/time string and the second is a number.
e.g

2016-01-19 13:12:38,2
2016-01-19 13:12:38,1
2016-01-19 13:12:38,0
2016-01-19 13:12:40,0
2016-01-19 13:12:41,0
2016-01-19 13:12:47,0

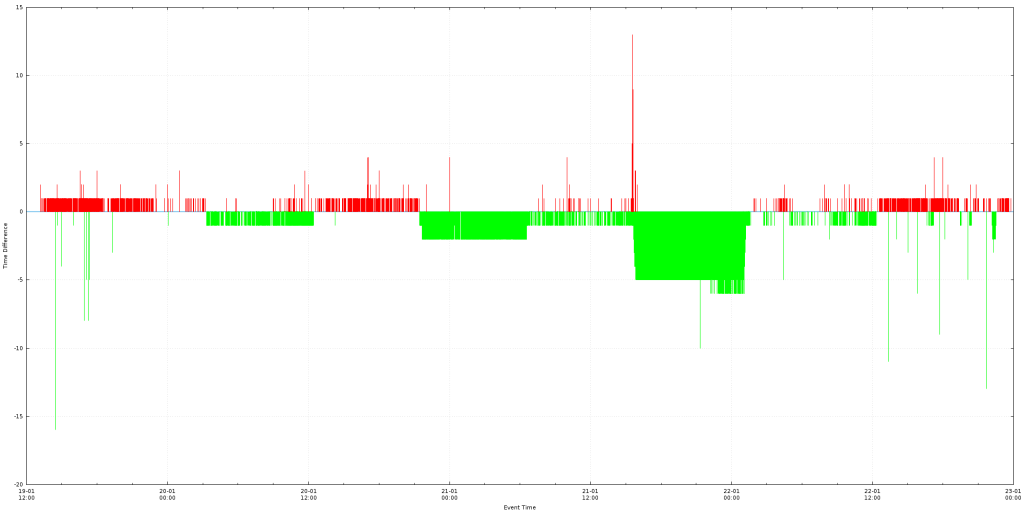
The chart will have on the X axis the date/time and on the Y axis the value of the second column.
All values under the 0 axis will be green and all values above it will be red.

Example output:

data.csv

Execution example: gnuplot -e "filename='data.csv'; width=2000; height=1000;" timeDifference.plot

#Setting output to be a PNG file of size 'width'x'height'
#'width' and 'height' are set from the command line. e.g gnuplot -e "filename='server_1.csv'; width=10000; height=500;" timeDifference.plot
#Setting the font of all text to be 'Verdana' size 8
set terminal pngcairo size width,height enhanced font 'Verdana,8'
#Setting the output filename to be the same as the input filename with the .png extension appended to it.
set output filename.'.png'

#We set the file separator to be the comma, this way we inform the engine that we will be processing a CSV file
set datafile separator ","

#Informing the engine that the X axis of our plot will be date/time data type
set xdata time
#We define how the date/time input must be parsed. In this example we expect the input to be like '2016-01-19 14:25:00'
set timefmt '%Y-%m-%d %H:%M:%S'

#We set the output format that will be shown on the X axis. Here we expect to show '19-01 New Line 14:25"
set format x "%d-%m\n%H:%M"
#Set the X axis label
set xlabel "Event Time"
#Set the Y axis label
set ylabel "Time Difference" 

#Enabling the Grid, this way major tick lines will be visible on the chart
set grid

#As we expect to have negative values as well, we make the zero Y axis line is thicker and has a different style from the rest so that it will be easier to spot
set xzeroaxis linetype 3 linewidth 1.5

#Creating a style for the lines that will be used in the plot. Type = 1, Color = green, Width = 1
set style line 1 linetype 1 linecolor rgb "green" linewidth 1.000
#Creating a style for the lines that will be used in the plot. Type = 1, Color = red, Width = 1
set style line 2 linetype 1 linecolor rgb "red" linewidth 1.000

#Actual plot command
#It directs the engine to plot the file that is in the filename variable, use the first and second column and use vertical columns with the styles we described above
#First line, We will plot only values that are greater or equal to 0, the rest we give 1/0 which is an invalid number and will not be plotted
#Second line, We will plot only values that are strictly less than 0, the rest we give 1/0 which is an invalid number and will not be plotted
plot filename using 1:($2 <= 0?$2:1/0) with impulses ls 1 notitle,\
filename using 1:($2 <= 0?1/0:$2) with impulses ls 2 notitle

Bluetooth Clicker (PC / Windows)

This is the partner application needed to operate the Android ‘Bluetooth PowerPoint Clicker‘.

Download the Initial Release: [download id=”1300″]

Instructions:

  1. Pair your device with your PC / Laptop via Bluetooth
  2. Download the Android ‘Bluetooth PowerPoint Clicker‘ to your device
  3. Download the PC / Windows application ([download id=”1300″]) that is needed for receiving the messages from your Android device and sending them to the PowerPoint application.
  4. Unzip the PC / Windows application and execute it. A console will pop-up saying “Waiting for connection”.
  5. Start the application on your Android device, on the pop-up list select your PC to connect
  6. Ready to use! 🙂

Get it on Google Play


[BitBucket.org] Clone all repositories of your account 2

Clone all bitbucket projects

 BBA=MyUserName; curl --user ${BBA} https://api.bitbucket.org/2.0/repositories/${BBA} | grep -o '"ssh:[^ ,]\+' | xargs -L1 git clone 

The above curl call will connect to the server using your username and return the list of repositories that are available to your account.

Please note that you need to provide you username NOT your email.
If you make these calls using the email that was used to register the account, then the call will fail.

After the call succeeds, the results will be filtered and each repository will be cloned to the current folder.
In case your ssh key is locked via a password, each time a clone operation will start, you will be asked for the password.

Example:

BBA="bytefreaks"; curl --user ${BBA} https://api.bitbucket.org/2.0/repositories/${BBA} | grep -o '"ssh:[^ ,]\+' | xargs -L1 git clone
Enter host password for user 'bytefreaks':
  % Total    % Received % Xferd  Average Speed   Time    Time     Time  Current
                                 Dload  Upload   Total   Spent    Left  Speed
100  3834  100  3834    0     0   4414      0 --:--:-- --:--:-- --:--:--  4411
Cloning into 'bluetoothclicker'...
Warning: Permanently added the RSA host key for IP address '104.192.143.1' to the list of known hosts.
Enter passphrase for key '/home/bytefreaks/.ssh/BitBucket/id_rsa': 
warning: You appear to have cloned an empty repository.
Checking connectivity... done.
Cloning into 'watch'...
Enter passphrase for key '/home/bytefreaks/.ssh/BitBucket/id_rsa': 
warning: You appear to have cloned an empty repository.
Checking connectivity... done.

List all bitbucket projects

In case what you want is just to list your repositories, execute the following:

 curl --user ${BBA} https://api.bitbucket.org/2.0/repositories/${BBA} | grep -o '"ssh:[^ ,]\+' | xargs -L1 echo 

Usage instructions: set your username to the BBA variable and execute.

BBA="bytefreaks"; curl --user ${BBA} https://api.bitbucket.org/2.0/repositories/${BBA} | grep -o '"ssh:[^ ,]\+' | xargs -L1 echo
Enter host password for user 'bytefreaks':
  % Total    % Received % Xferd  Average Speed   Time    Time     Time  Current
                                 Dload  Upload   Total   Spent    Left  Speed
100  3834  100  3834    0     0   3543      0  0:00:01  0:00:01 --:--:--  3546
ssh://[email protected]/bytefreaks/bluetoothclicker.git
ssh://[email protected]/bytefreaks/watch.git

Most traded currencies by value (December 2015) 1

Most traded currencies by value
Currency distribution of global foreign exchange market turnover
Rank Currency ISO 4217 code
(Symbol)
% daily share
(December 2015)
1
United States dollar
USD ($)
87.0%
2
Euro
EUR (€)
33.4%
3
Japanese yen
JPY (¥)
23.0%
4
Pound sterling
GBP (£)
11.8%
5
Swiss franc
CHF (CHF)
8.6%
6
Canadian dollar
CAD ($)
5.2%
7
Australian dollar
AUD ($)
4.6%
8
Mexican peso
MXN ($)
2.5%
9
Chinese yuan
CNY (¥)
2.2%
10
New Zealand dollar
NZD ($)
2.0%
11
Swedish krona
SEK (kr)
1.8%
12
Russian ruble
RUB (₽)
1.6%
13
Hong Kong dollar
HKD ($)
1.4%
14
Norwegian krone
NOK (kr)
1.4%
15
Singapore dollar
SGD ($)
1.4%
16
Turkish lira
TRY (₺)
1.3%
17
South Korean won
KRW (₩)
1.2%
18
South African rand
ZAR (R)
1.1%
19
Brazilian real
BRL ($)
1.1%
20
Indian rupee
INR (₹)
1.0%
Other 6.3%
Total 200%

–From Wikipedia, the free encyclopedia