Practice Problem for Google Hash Code 2018
[2021] Click here for Google Hash Code 2021 – Practice Problem
Happy new year people!!
Google released a practice problem for Google Hash Code 2018!
Please do not forget to register!
[download id=”4172″]
[download id=”4182″]
Submission deadline: Thursday, Mar 1, 19:00 Cyprus time (18:00 CET)
—
Pizza
Practice Problem for Hash Code
Introduction
Did you know that at any given time, someone is cutting pizza somewhere around the world? The decision about how to cut the pizza sometimes is easy, but sometimes it’s really hard: you want just the right amount of tomatoes and mushrooms on each slice. If only there was a way to solve this problem using technology…
Problem description
Pizza
The pizza is represented as a rectangular, 2-dimensional grid of R rows and C columns. The cells within the grid are referenced using a pair of 0-based coordinates [r, c] , denoting respectively the row and the column of the cell.
Each cell of the pizza contains either:
- mushroom, represented in the input file as
M; or - tomato, represented in the input file as
T
Slice
A slice of pizza is a rectangular section of the pizza delimited by two rows and two columns, without holes.
The slices we want to cut out must contain at least L cells of each ingredient (that is, at least L cells of mushroom and at least L cells of tomato) and at most H cells of any kind in total – surprising as it is, there is such a thing as too much pizza in one slice.
The slices being cut out cannot overlap. The slices being cut do not need to cover the entire pizza.
Goal
The goal is to cut correct slices out of the pizza maximizing the total number of cells in all slices.
Input data set
The input data is provided as a data set file – a plain text file containing exclusively ASCII characters with lines terminated with a single \n character at the end of each line (UNIX- style line endings).
File format
The file consists of:
- one line containing the following natural numbers separated by single spaces:
R(1 ≤ R ≤ 1000) is the number of rows,C(1 ≤ C ≤ 1000) is the number of columns,L(1 ≤ L ≤ 1000) is the minimum number of each ingredient cells in a slice,H(1 ≤ H ≤ 1000) is the maximum total number of cells of a slice
Rlines describing the rows of the pizza (one after another). Each of these lines containsC
characters describing the ingredients in the cells of the row (one cell after another). Each character is eitherM(for mushroom) orT(for tomato).
Example Input File
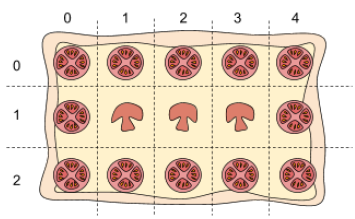
3 5 1 6
TTTTT
TMMMT
TTTTT
3 rows, 5 columns, min 1 ingredient per slice, max 6 cells per slice
Submissions
File format
The file must consist of:
- one line containing a single natural number
S(0 ≤ S ≤ R × C) , representing the total number of slices to be cut, Ulines describing the slices. Each of these lines must contain the following natural numbers
separated by single spaces:r1,c1,r2,c2(0 ≤ r1,r2 < R,0 ≤ c1,c2 < C) describe a slice of pizza delimited by the rowsr1andr2and the columnsc1andc2, including the cells of the delimiting rows and columns. The rows (r1andr2) can be given in any order. The columns (c1andc2) can be given in any order too.
Example
3
0 0 2 1
0 2 2 2
0 3 2 4
Example description
3 slices.
First slice between rows (0,2) and columns (0,1).
Second slice between rows (0,2) and columns (2,2).
Third slice between rows (0,2) and columns (3,4).
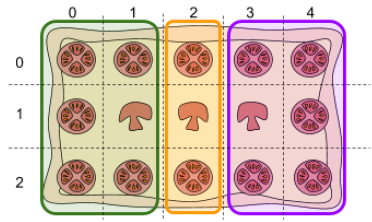
Slices described in the example submission file marked in green, orange and purple.
Validation
For the solution to be accepted:
- the format of the file must match the description above,
- each cell of the pizza must be included in at most one slice,
- each slice must contain at least
Lcells of mushroom, - each slice must contain at least
Lcells of tomato, - total area of each slice must be at most
H
Scoring
The submission gets a score equal to the total number of cells in all slices.
Note that there are multiple data sets representing separate instances of the problem. The final
score for your team is the sum of your best scores on the individual data sets.
Scoring example
The example submission file given above cuts the slices of 6, 3 and 6 cells, earning 6 + 3 + 6 = 15 points.
Past editions
— From https://hashcode.withgoogle.com/past_editions.html
Hash Code started in 2014 with just 200 participants from France. In 2017, more than 26,000 participants from across Europe, the Middle East and Africa took part in the competition. You can take a look at the problems and winning teams from past editions of Hash Code below.
Past problem statements
Router placement
Hash Code 2017, Final Round
[download id=”4175″]
Who doesn’t love wireless Internet? Millions of people rely on it for productivity and fun in countless cafes, railway stations and public areas of all sorts. For many institutions, ensuring wireless Internet access is now almost as important a feature of building facilities as the access to water and electricity. Typically, buildings are connected to the Internet using a fiber backbone. In order to provide wireless Internet access, wireless routers are placed around the building and connected using fiber cables to the backbone. The larger and more complex the building, the harder it is to pick router locations and decide how to lay down the connecting cables.
Streaming videos
Hash Code 2017, Online Qualification Round
[download id=”4178″]
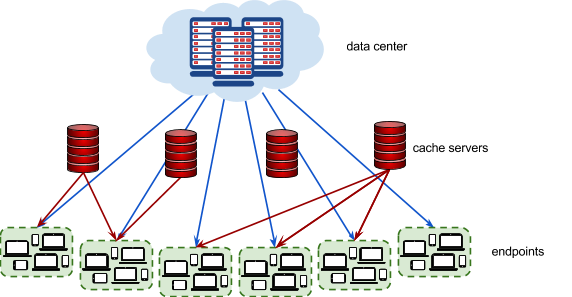
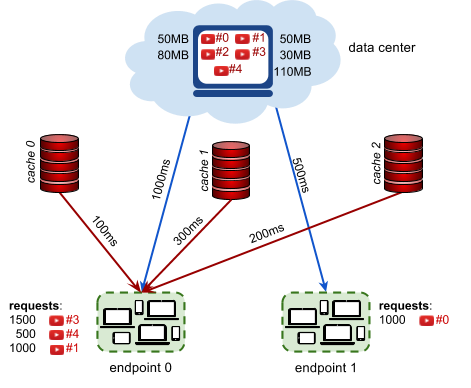
Have you ever wondered what happens behind the scenes when you watch a YouTube video? As more and more people watch online videos (and as the size of these videos increases), it is critical that video-serving infrastructure is optimized to handle requests reliably and quickly. This typically involves putting in place cache servers, which store copies of popular videos. When a user request for a particular video arrives, it can be handled by a cache server close to the user, rather than by a remote data center thousands of kilometers away. Given a description of cache servers, network endpoints and videos, along with predicted requests for individual videos, decide which videos to put in which cache server in order to minimize the average waiting time for all requests.
Schedule Satellite Operations
Hash Code 2016, Final Round
[download id=”2596″]
A satellite equipped with a high-resolution camera can be an excellent source of geo imagery. While harder to deploy than a plane or a Street View car, a satellite — once launched — provides a continuous stream of fresh data. Terra Bella is a division within Google that deploys and manages high-resolution imaging satellites in order to capture rapidly-updated imagery and analyze them for commercial customers. With a growing constellation of satellites and a constant need for fresh imagery, distributing the work between the satellites is a major challenge. Given a set of imaging satellites and a list of image collections ordered by customers, schedule satellite operations so that the total value of delivered image collections is as high as possible.
Optimize Drone Deliveries
Hash Code 2016, Online Qualification Round
[download id=”2595″]
The Internet has profoundly changed the way we buy things, but the online shopping of today is likely not the end of that change; after each purchase we still need to wait multiple days for physical goods to be carried to our doorstep. Given a fleet of drones, a list of customer orders and availability of the individual products in warehouses, schedule the drone operations so that the orders are completed as soon as possible.
Route Loon Balloons
Hash Code 2015, Final Round
[download id=”2594″]
Project Loon aims to bring universal Internet access using a fleet of high altitude balloons equipped with LTE transmitters. Circulating around the world, Loon balloons deliver Internet access in areas that lack conventional means of Internet connectivity. Given the wind data at different altitudes, plan altitude adjustments for a fleet of balloons to provide Internet coverage to select locations.
Optimize a Data Center
Hash Code 2015, Online Qualification Round
[download id=”2593″]
For over ten years, Google has been building data centers of its own design, deploying thousands of machines in locations around the globe. In each of these of locations, batteries of servers are at work around the clock, running services we use every day, from Google Search and YouTube to the Judge System of Hash Code. Given a schema of a data center and a list of available servers, your task is to optimize the layout of the data center to maximize its availability.
Street View Routing
Hash Code 2014, Final Round
[download id=”2592″]
The Street View imagery available in Google Maps is captured using specialized vehicles called Street View cars. These cars carry multiple cameras capturing pictures as the car moves around a city. Capturing the imagery of a city poses an optimization problem: the fleet of cars is available for a limited amount of time and we want to cover as much of the city streets as possible.