Applications


Create a graph out of an XML file

To create a graph out of an XML file, we used the yEd graph editor.
yEd is a desktop application that can be used to generate diagrams. It is free of charge (not FOSS) and runs on all major platforms: Windows, Unix/Linux, and Mac OS X.

For the following demo we used the latest release for GNU/Linux that was available at the time (yEd-3.17.1).

Usage Example

  1. Download yEd
  2. Extract it
  3. Navigate into the generated folder (e.g. if you used the attached version then the folder will be yed-3.17.1)
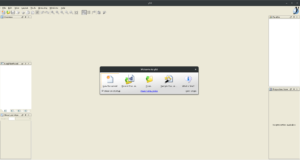
  4. Start the application using a JRE. In our case the command to start it was: java -jar yed.jar
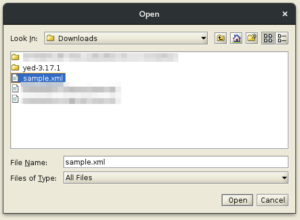
  5. Click on the Open option (or go to File > Open... )
  6. Navigate to the XML file that you want to graph and click Open
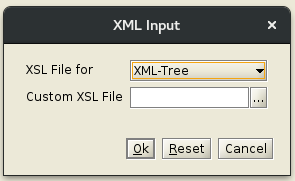
  7. In the pop-up window for the drop-down named XSL File for then select the option XML-Tree and click Ok
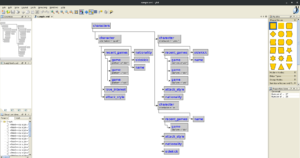
  8. By now you should have your graph available to view/edit/export

IEEETran Latex Template – Add Copyrights on left bottom of first page of Conference class 2

Using the conference class in the IEEETran Latex template, it blocks you from using the IEEEpubid command that can be used to add the copyright note on the bottom of the screen.

Attempt 1 – Enable overrides only

We added the IEEEoverridecommandlockouts command right after the documentclass directive, that allows us to use functionality in IEEETran that should be blocked depending on the document class.
Then we used the IEEEpubid command right after the documentclass directive to create and print the copyright note:

\IEEEpubid{978-1-5386-2880-5/17/\$31.00~\copyright~2017 IEEE}

Doing so, resulted in printing the copyright note in the bottom middle of the first page. The conference class is a two column style, the left column got pushed up a bit to make space, while the right did not. In the end, half of the copyright note was overlapping with the second column.

Attempt 2 – Solution – Customize IEEEpubid as well

After documentclass we added the IEEEoverridecommandlockouts command to enable functionality that is blocked for the conference class.
Then we created our own IEEEpudid command that places itself in a column and not a page as follows:

\documentclass[conference]{IEEEtran}
%Enabled blocked functionality
\IEEEoverridecommandlockouts
%Define custom IEEEpubid that will place it self in a column and not a page, suitable from conference class
\IEEEpubid{\makebox[\columnwidth]{978-1-5386-2880-5/17/\$31.00~\copyright~2017 IEEE \hfill} \hspace{\columnsep}\makebox[\columnwidth]{ }}

Finally after the maketitle command we added IEEEpubidadjcol to give more space between the copyright note and the body of first column.

\maketitle
%Add space between copyright and text
\IEEEpubidadjcol

Making an animated torus in gnuplot and gimp

The gnuplot code in this article, creates several frames of a 3D torus with a visible structural grid from different viewing angles, like the one in the image below.

[download id=”3549″]

In geometry, a torus (plural tori) is a surface of revolution generated by revolving a circle in three-dimensional space about an axis coplanar with the circle. If the axis of revolution does not touch the circle, the surface has a ring shape and is called a torus of revolution.

From Wikipedia https://en.wikipedia.org/wiki/Torus

By modifying the circles and rings variables in the script you can increase and decrease the number of circles and rings that appear on your torus.
The above image was generated using 60 circles and 30 rings.

To better explain what a circle and what a ring is, please have a look at the following two examples.

The following torus has 10 circles and 30 rings.

The next one has 60 circles and 10 rings.

The last torus has 10 circles and 10 rings.

Using the script, you can also play around with the set view command and the for loop to change the number of frames that will be produced and what movement should the camera perform before printing.

[download id=”3549″]

set terminal pngcairo transparent enhanced font "arial,10" fontscale 1.0 size 700, 400

unset key
unset border
unset tics

set dummy u, v

circles=60
rings=30

set parametric
set isosamples circles, rings
set hidden3d back offset 1 trianglepattern 3 undefined 1 altdiagonal bentover
set urange [ -pi : pi ] noreverse nowriteback
set vrange [ -pi : pi ] noreverse nowriteback

do for [i=1:360/circles] {
 set view 25, i, 1, 1
 set output sprintf('game-of-life-torus.%03.0f.png', i)
 splot cos(u)+.5*cos(u)*cos(v),sin(u)+.5*sin(u)*cos(v),.5*sin(v) with lines
}

[download id=”3549″]

Below, you can see two examples of animation we build together using the gimp application.

Showing one frame at a time.

Accumulating all frames into one, until the loop is reset.

To create the animation we followed the next steps:

  1. Executed gnuplot torus.gnuplot to generated the frames.
  2. Then we started the gimp and from the menu File we chose the option Open as layers... (Ctrl + Alt + o).
  3. We selected all the images we wanted for our animation and pressed the Open button.
  4. The Layers - Brushes window got populated by the new frames. Please note that window you can use that to change the order of the frames (which are now the layers).
  5. Following, from the menu File we chose the option Export As... (Shift + Ctrl + E), from the pop-up window we selected the type of the file to be gif and pressed the Export button.
  6. At the final pop-up window, we enabled the As animation checkbox, then at the Frame disposal where unspecified dropdown menu we chose One frame per layer (replace) and hit the Export button which produce the first animation in this article (two images up).

This figure shows the ‘Layers – Brushes’ window that got populated by the new frames.

From the menu File we chose the option Export As… (Shift + Ctrl + E), from the pop-up window we selected the type of the file to be ‘gif’ and pressed the Export button.

At the final pop-up window, we enabled the As animation checkbox, then at the Frame disposal where unspecified dropdown menu we chose One frame per layer (replace) and hit the Export button which produce the first animation in this article (two images up).